Erik Fredericks, frederer@gvsu.edu Fall 2025
Based on material provided by Erin Carrier, Austin Ferguson, and Katherine Bowers
What is debugging?
What is a debugger?
Why use a debugger?
We’ll be using gdb (GNU Project Debugger)
gdb
Steps to run gdb:
gcc -g my_code.c
gdb ./a.out
You will likely not have gdb
lldb
Use will be very similar, but some commands will have different names.
Reference: https://lldb.llvm.org/use/map.html
You can run commands within gdb, basics include:
run
run arg1 arg2
run < input_file > output_file
quit
kill
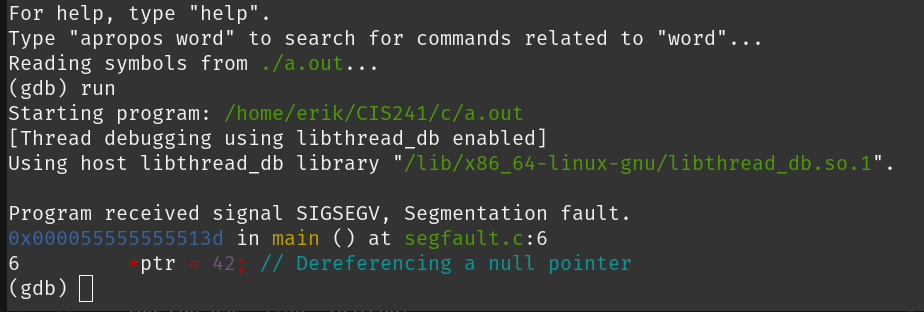
segfault
♪~ ᕕ(ᐛ)ᕗ
Start gdb to run program
Examine the callstack with backtrace or bt
backtrace
bt
Load a frame (f) using its number (e.g., f 1)
f
f 1
You can use list to get more context
list
Check the state of your variables
Print a variable with print (or p) (e.g., p size)
print
p
p size
Print n items of an array with *array@n
*array@n
You can also use breakpoints to pause your code
To set a breakpoint:
break function_name
break line_number
break line_number if condition
To list all breakpoints: info break
info break
continue will resume until next breakpoint
continue
step to execute one line of code
step
step n
enable/disable breakpoint_number
delete breakpoint_number (delete for all)
delete breakpoint_number
delete
Valgrind: "a suite of tools for debugging and profiling programs"
Recommendation: memcheck
memcheck
valgrind --tool=memcheck ./a.out
This will check for memory leaks and other hard-to-spot memory issues!
point out the ./a.out and (gdb) interface
set breakpoint in function (break test) frame 0 frame 1
break 5 step step