Table of contents
Lab 9 - Accelerometer!
Our last sensor we’ll be playing with is the accelerometer.
Lab signoff
Before you leave for the day, (minimally) show me:
- Your device printing accelerometer data to the terminal to the same place.
Make your backup
New lab, new code. Make your backup as is tradition.
Getting started
Ensure you have the adafruit_circuitplayground library installed (should be a folder copy from our downloaded library bundle). It makes using the accelerometer much easier.
This will significantly mess with anything related to the neopixels, so if you have designs on including them you’ll need to translate your code to the adafruit_circuitplayground style of interacting with them! See Adafruit - NeoPixels for more information.
First, the accelerometer
Your devices have an accelerometer built in that we can access pretty easily.

Essentially, it measures acceleration on all axes (x, y, and z), including gravity (read more up on acceleration here).
If your device is lying flat, it should read (0, 0, 9.8) for acceleration, though it will probably not quite be that perfect. For instance, my board using the demo code (below) looks like this.
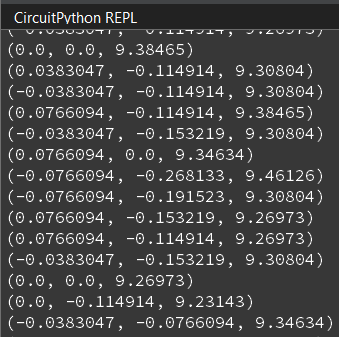
What is the 9.8 value?
Here’s the demo code from the acceleration link above:
"""
This example uses the accelerometer on the Circuit Playground. It prints the values. Try moving
the board to see the values change. If you're using Mu, open the plotter to see the values plotted.
"""
import time
from adafruit_circuitplayground import cp

while True:
    x, y, z = cp.acceleration
    print((x, y, z))

    time.sleep(0.1)
Interestingly, the plotter works for this code as well. Open the Plotter in Mu and check out the values being drawn!
Wondering about the plotter and how to use it? Check out this link. The tl;dr is you need to be printing a tuple of information for it to work.
Now, try moving your device around and getting a feeling for the different values. One way you can do that is to isolate an axis to rotate around. For instance, only make one rotational or translational motion on an axis to see things happen.
Get them working with LEDs
This code is also from Adafruit, but now your LEDs are working with your accelerometer. I’m including this verbatim because we now have to interact with our LEDs using the adafruit_circuitplayground library, rather than the board library we’re used to. I did modify it slightly to include a delay, otherwise Mu tends to freeze up.
Interestingly, the example also includes example code for working with the slide switch!
"""If the switch is to the right, it will appear that nothing is happening. Move the switch to the
left to see the NeoPixels light up in colors related to the accelerometer! The Circuit Playground
has an accelerometer in the center that returns (x, y, z) acceleration values. This program uses
those values to light up the NeoPixels based on those acceleration values."""

from adafruit_circuitplayground import cp
import time

# Main loop gets x, y and z axis acceleration, prints the values, and turns on
# red, green and blue, at levels related to the x, y and z values.
while True:
    if not cp.switch:
        # If the switch is to the right, it returns False!
        print("Slide switch off!")
        cp.pixels.fill((0, 0, 0))
        continue
    R = 0
    G = 0
    B = 0
    x, y, z = cp.acceleration
    print((x, y, z))
    cp.pixels.fill(((R + abs(int(x))), (G + abs(int(y))), (B + abs(int(z)))))

    time.sleep(0.1)
We now have accelerometer values that are read and are translated to LED colors. A quick diversion into math and then we’ll add in Bluetooth.
A diversion: math
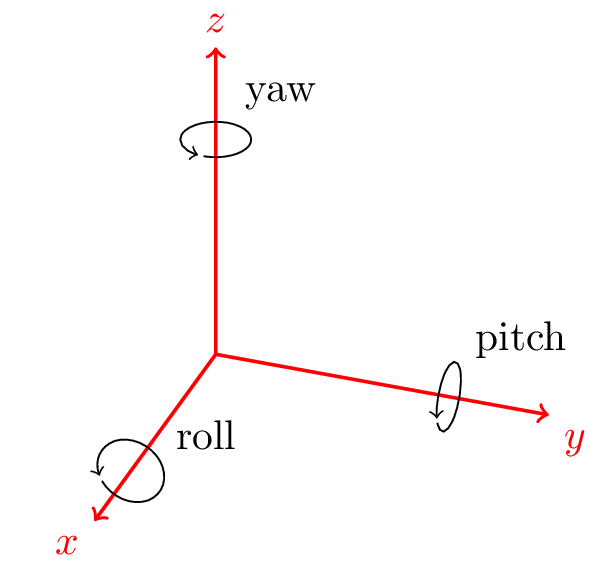
One thing we can use accelerometer values for is visualizing a model in space. Typically what one does in this situation is to convert the acceleration values over to rotations.
HOWEVER.
In doing so, we actually lose a degree of freedom - we’re actually going to need an additional sensor to calculate yaw. So, we can only calculate roll and pitch! This is because we’re using the x, y, and z values to calculate roll and pitch. If you wanted to get yaw as well you’d need a gyro sensor (not included on the Bluefruit/Express).
If you are interested, here are a few explanations:
- Accelerometer data: How to interpret?
- How to estimate yaw angle from tri-axis accelerometer and gyroscope
- Possible to convert accelerometer x,y,z measurements into quaternion?
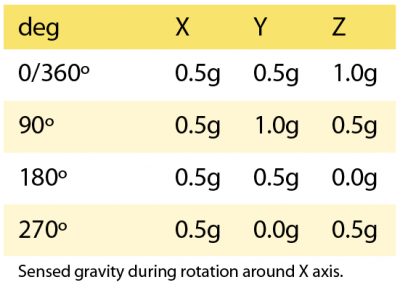
The first link actually lets us understand why when you start rotating it fully around an axis that it slides back - the accelerometer values go back to home, meaning any rotation angle calculated will go from 0 to 180 and then back to 0 (rather than going the full 360 degrees).
The next bit is interesting in terms of using those values. To get rotational angles from accelerometer values we can transform them into quaternions (or, rotational angles that use imaginary numbers).
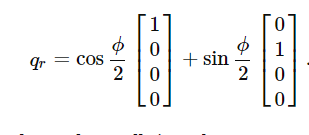
We would get the rotational angles (ϕ -> roll, θ -> pitch) like so (c/o the StackOverflow link above):
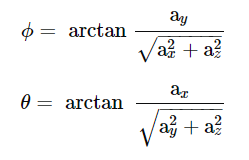
And then convert it to the quaternion for roll (a similar equation exists for pitch):
If you are interested in getting a Bluefruit talking to your browser via Bluetooth, last year’s lab has you interacting with a WebGL application I wrote as a demo for CIS367 and this class. You could extend it to use serial instead if you have an Express, but that would require a separate library plus managing the serial connection (Windows, Linux, and Macs all handle serial paths differently).
Second, live updates in the terminal
There are innumberable things you can do with all the sensors at hand. However, without additional displays or capabilities it is difficult to communicate what is happening.
Let’s go ahead and make a live terminal. This is something that involves ASCII code trickery that enables you to use the terminal without having to print a million lines, and relies on escape codes.
Unfortunately, support for the codes varies from machine to machine and terminal to terminal, so there’s a pretty good possibility that none of the color codes will work in your serial terminal (i.e., popping open Serial in Mu).
Ok, let’s extend your current code. We want the accelerometer values to be printed to serial without scrolling off the screen.
Comment out the print((x, y, z)) statement.
Replace it with:
print(f"\33[K{x}, {y}, {z}")
print("\33[1A", end="")
In the lines above, be careful with auto-complete as you don’t want an ending square bracket.
So, what you should be seeing is a line being updated. The \33[K erases to the end of the line, and the \33[1A moves the cursor up a line. Replace the 1 with the number of lines you want it to move up (so if you wrote out 5 lines, then it’d be 5A). The end="" line suppresses newlines.
Ok, let’s get you prepped to do some nicely formatted outputs. You’ll get a taste here and then you’ll be extending it for the homework.
Two things we want to do are to use tabs to provide a nice output format and truncating the output so that we only show a certain amount of precision.
Update your print statement again to lop off precision:
print(f"\33[K{x:.3f},\t{y:.3f},\t{z:.3f}")
And we can break it up a touch to make the formatting a bit nicer.
print(f"\33[KAccelerometer values")
print(f"\33[KX: {x:.3f}")
print(f"\33[KY: {y:.3f}")
print(f"\33[KZ: {z:.3f}")

print("\33[4A", end="")
Note the placement of the X: string - looks odd but that’s where you’d put a non-variable if you wanted it to start at the beginning. Additionally, note that the last line is now 4A…
The homework
You have the current accelerometer values being printed. Add the following fields to your output:
- The current temperature, with unit, from your thermistor
- The minimum temperature, with unit, recorded from your thermistor from the current session
The maximum temperature, with unit,recorded from your thermistor from the current session
- The current light value from your light sensor
- The minimum light value recorded from your light sensor from the current session
- The maximum light value recorded from your light sensor from the current session
Reading the temperature and light values with the adafruit_circuitplayground library means using cp.temperature and cp.light, respectively.
Want extra credit? Have your LEDs react to the direction you’re tilting the device.
In the beginning of the lab we were setting LEDs based on a fairly naive check of our accelerometer data. One thing you could do is implement a “marble” type game where your accelerometer controls the position of the marble (pretend you have a marble on a board and tilting it changes its position).
Note: you probably don’t need all x/y/z values to make this work…
So, what I’d expect to see here is a single LED lit up and moving about based on the orientation of the device - random movement isn’t going to count!
AND/OR
Make a prettier table than the one I had you do. There are many different ways you could do this, and potentially libraries out there that you could use.
Tell me in your report what you did!
Planning for next week
Next week’s lab will have you working on your term project and demonstrating to me your progress. If you need additional hardware plan to bring it!